


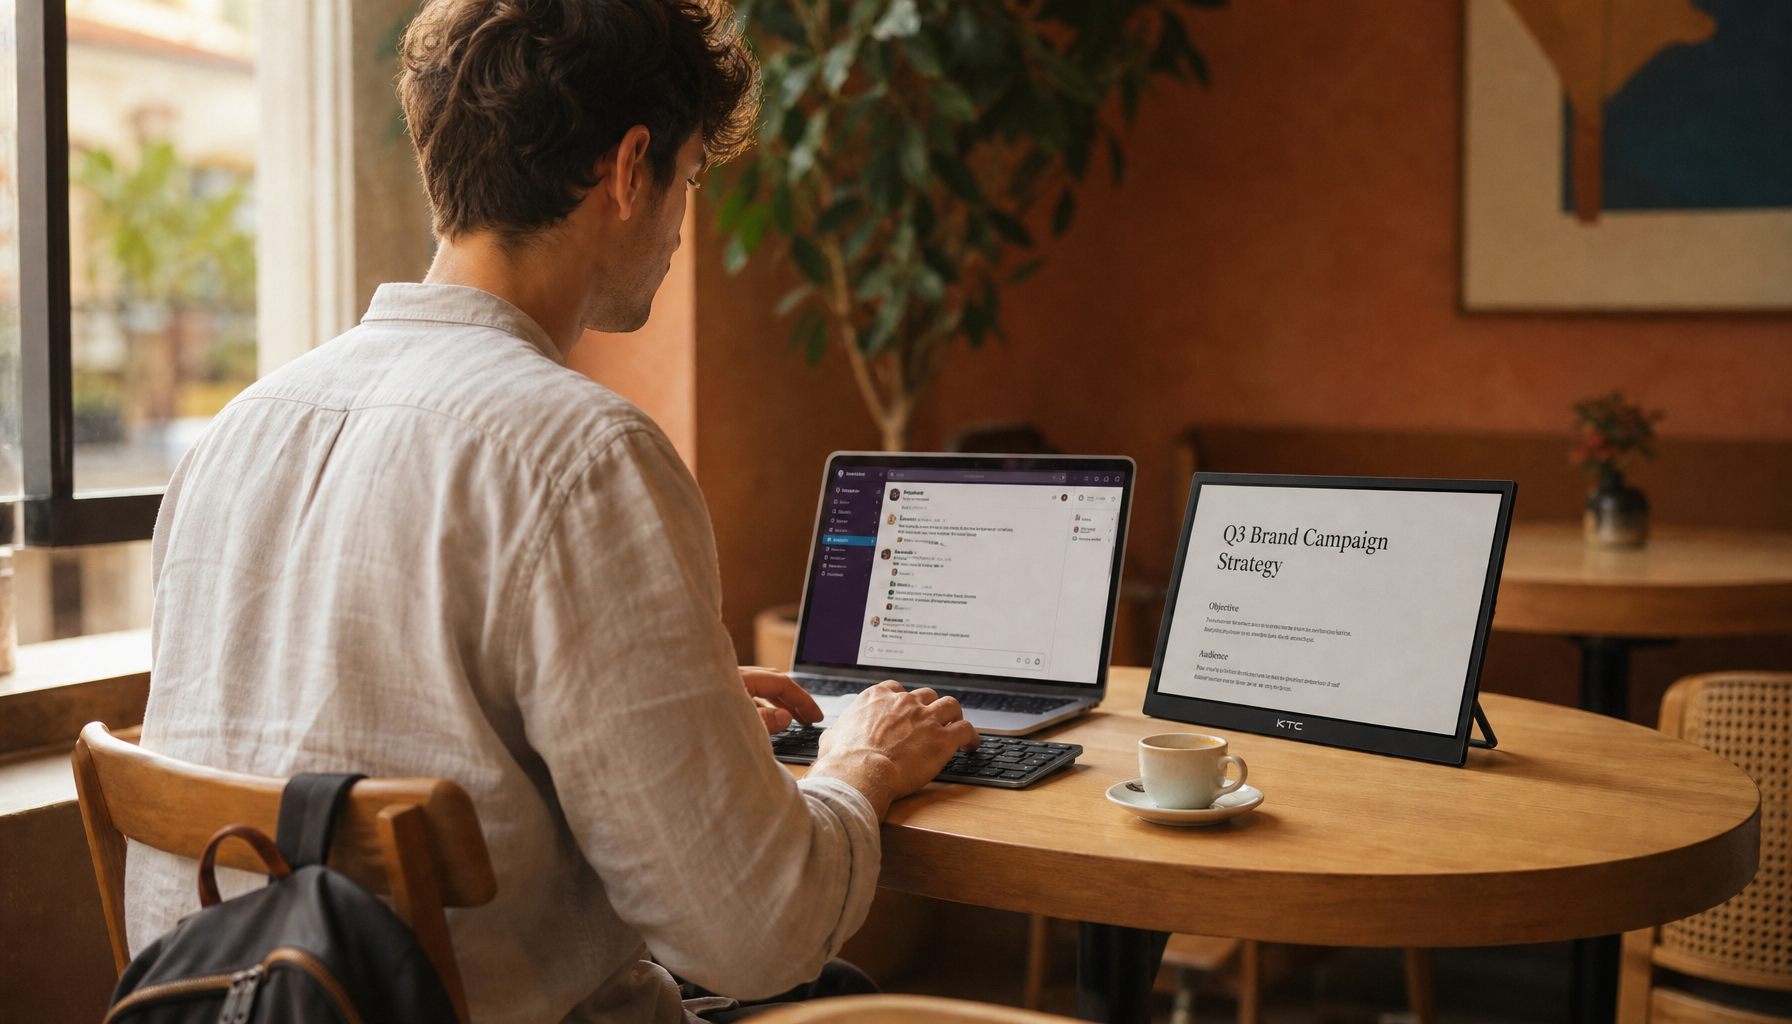
A dedicated dashboard monitor solves the core frustration for DevOps engineers, SREs, and AI researchers who lose focus when constantly switching between coding environments and live server metrics. By offloading real-time observability—GPU utilization, training loss curves, alert panels, and cluster health—to a high-density secondary screen, you keep your primary workflow uninterrupted while maintaining at-a-glance visibility of mission-critical data.
This setup works best when your primary monitor handles IDEs, notebooks, or modeling tools, and the secondary display stays locked in kiosk-style dashboard mode. The key decision factors are resolution for information density, panel choice for 24/7 reliability, ergonomic placement to avoid strain, and conservative settings to prevent image retention or visual artifacts. Prioritizing 4K over high refresh rates, and stability over maximum contrast, typically delivers the most practical long-term value for persistent monitoring.

Why Your Primary Workflow Needs a Dedicated Metrics Monitor
Constantly alt-tabbing or resizing browser tabs to check Grafana, Prometheus alerts, or AI training metrics creates unnecessary cognitive load. For professionals managing GPU clusters or production infrastructure, even brief context switches can delay incident response or disrupt deep focus on model tuning.
A dedicated peripheral screen acts as a persistent command center. It keeps multiple dashboard panels visible without consuming primary real estate needed for code, terminals, or experiment logs. In typical AI lab or DevOps setups, this separation improves situational awareness: you notice anomalies in peripheral vision rather than interrupting your main task.
The practical test is simple. If you find yourself frequently losing track of resource spikes or error rates while working, a secondary high-resolution monitor configured for always-on observability usually resolves the friction better than adding more tabs or a larger single display.
Hardware Specs That Matter: Resolution, PPI, and Panel Choice
For observability dashboards, resolution and pixel density matter far more than refresh rate. A 4K (3840x2160) panel at 27 inches provides enough real estate to display several Grafana rows side-by-side with legible text and graphs, avoiding constant scrolling or zooming that plagues lower-resolution options.
Higher PPI (pixels per inch) sharpens small labels, log lines, and axis values. A 27-inch 4K monitor typically delivers around 163 PPI, making dense multi-panel layouts easier to read than a larger 32-inch 1440p screen at roughly 110 PPI. This density difference becomes noticeable during long sessions reviewing training metrics or infrastructure overviews.
Panel technology choices involve clear trade-offs. Mini-LED models like the KTC M27P6 offer excellent brightness for well-lit labs and strong contrast without the burn-in risk of OLED, making them suitable for static UI elements. Standard IPS options, such as the KTC H27P22S or H27P27, often suffice for most users and avoid the need for local dimming adjustments.
Connectivity simplifies setup. Monitors with 90W USB-C power delivery, like many KTC 4K models, reduce cable clutter by carrying video, data, and charging in one connection—useful for laptop-based monitoring stations. However, under sustained high-brightness loads, verify your host device can maintain stable power delivery to prevent battery drain.
For most observability users, start by confirming your target resolution fits the dashboard layout you actually use. If your Grafana dashboards require more than two columns of detailed panels without scrolling, 4K at 27 inches is the safer baseline. Check our guide to the best monitor for productivity for broader workspace considerations.

Software Integration: Configuring Grafana for Persistent Observability
Once hardware is in place, the software layer turns the monitor into a true dedicated display. Grafana’s built-in tools are designed for this exact scenario. As the official Grafana documentation explains, Kiosk Mode—activated with the simple keyboard shortcut “d k”—hides navigation bars, side menus, and other UI chrome to maximize metric visibility.
For rotating between different views, create Playlists that automatically cycle through infrastructure summaries, GPU cluster details, and training progress dashboards at set intervals. This keeps the secondary screen dynamic without manual intervention.
Browser-level optimizations further clean the experience. Use a dedicated Chrome or Firefox profile with extensions that enforce fullscreen or app-like behavior, removing address bars and tabs. On Linux systems, kiosk-mode browser flags or tools like Chromium’s --kiosk option can lock the display into a single dashboard. The goal is zero wasted pixels so every inch contributes to observability.
Test the configuration by running it alongside your primary workflow for a full day. If you still find yourself reaching for the mouse to adjust views, refine the playlist timing or add a second dashboard row that fits comfortably within the 4K canvas.
The Command Center Layout: Ergonomics for Peripheral Monitoring
Poor placement turns a helpful secondary screen into a source of neck and eye strain. The evidence-based approach centers on keeping the dashboard in comfortable peripheral vision rather than requiring constant head turns.
Position the monitor at roughly a 30-degree angle from your primary display, as recommended in ergonomic guidance from UC Davis Safety Services. This angle keeps critical alerts and graphs visible without significant neck rotation. Align the top of both screens at or slightly below eye level, and maintain a viewing distance of about one arm’s length (roughly 20–40 inches), per CCOHS positioning standards.
A VESA-compatible monitor arm makes fine-tuning easy and frees desk space. Many KTC models, including the M27P6 and H27P6, support standard VESA mounts for precise 30-degree placement. In practice, users often regret fixed stands that force awkward angles during long sessions; an adjustable arm usually prevents that.
Our related article on vertical vs horizontal dual monitor setups explores additional layout strategies that complement this peripheral dashboard approach.
Operational Reliability: Managing 24/7 Always-On Dashboards
Static dashboards running 24/7 introduce risks that gaming-oriented settings can exacerbate. LCD panels, including high-quality IPS and Mini-LED, can develop temporary or permanent image retention when bright static elements remain visible for extended periods. Capping brightness at 50–70% (typically 200–300 nits) and preferring dark-gray backgrounds over pure black helps mitigate this, according to manufacturer guidance on preventing LCD image retention.
For Mini-LED models like the M27P6, local dimming requires careful tuning. High dimming levels can produce noticeable backlight pulsing or haloing whenever metrics refresh or values change—distracting in a peripheral monitoring role. Setting local dimming to Low or Off usually improves stability for text-heavy Grafana layouts, even though it reduces the panel’s peak contrast advantage. This trade-off favors reliability over cinematic HDR for observability use.
Cable quality and power delivery also affect long-term uptime. High-quality DisplayPort 1.4 or HDMI 2.1 cables reduce handshake issues during wake-from-sleep cycles common in multi-monitor Linux or macOS workstations. USB-C setups with 90W delivery simplify cabling but may experience minor power sag under maximum load; test your specific laptop-monitor combination before committing to always-on operation.
A practical self-check: run the dashboard at your chosen brightness and dimming settings for 48 hours. If you notice pulsing during normal metric updates or faint ghosting in sidebars, lower the settings further. These adjustments rarely compromise the ability to read critical values but significantly extend panel longevity.
Building Your Observability Command Center Today
Implementing this setup follows a short, repeatable sequence that balances hardware, software, and ergonomics.
First, select a 4K monitor with strong PPI and suitable panel technology. The KTC M27P6 Mini-LED suits bright environments needing high contrast, while the H27P27 4K office monitor or similar IPS models provide reliable performance at a lower price point. Verify VESA compatibility for flexible mounting.
Second, mount the display on an adjustable arm at the 30-degree peripheral position and connect via USB-C or DisplayPort for clean cable management. Configure your operating system to treat it as a dedicated secondary display.
Third, launch Grafana in Kiosk Mode, set up relevant Playlists, and lock in conservative brightness and dimming settings. Test the full command center during a normal workday, adjusting layout or software behavior as needed.
Professionals who follow this path often report fewer missed alerts and reduced mental overhead. If your current single-monitor workflow already feels sufficient, adding a dedicated dashboard may be unnecessary overhead. For those handling production AI training or complex infrastructure, however, the separation of concerns usually proves worthwhile.
Explore our USB-C monitor guide for more on simplifying multi-device workstations, or browse the full 4K monitor collection to compare models suited to observability.
How Much Resolution Is Actually Needed for Grafana Dashboards?
Most users find 4K at 27 inches sufficient to display 3–4 detailed panels without scrolling, while 1440p often requires zooming or simplification. The deciding factor is whether your dashboards contain many small text labels or dense time-series graphs. If you frequently zoom in to read values, upgrade to 4K; otherwise a high-quality 1440p monitor paired with careful panel layout may suffice.
Should I Use Mini-LED or Standard IPS for a 24/7 Dashboard?
Mini-LED provides better contrast and brightness headroom for lab environments, but requires lowering local dimming to avoid pulsing artifacts on static elements. Standard IPS panels are often simpler to configure for always-on use and avoid the “toggle tax” of adjusting settings between monitoring and other tasks. Choose Mini-LED only if your room lighting demands higher peak luminance; otherwise IPS delivers reliable performance with fewer adjustments.
Does a Dedicated Monitor Eliminate the Need for Alerts in My Primary Workflow?
No. A well-configured dashboard improves passive awareness, but critical paging, email, or Slack alerts should remain active on your main machine. The secondary screen excels at trend visualization and at-a-glance status, not replacing proactive notification systems. Combine both for best results.
Can One Monitor Handle Both Gaming and Persistent Monitoring?
It can, but requires discipline. Many KTC dual-mode or high-refresh 4K models support the resolution needed for dashboards, yet users often regret leaving aggressive settings enabled during monitoring sessions. If you switch between gaming and observability daily, plan on saving separate display profiles or accepting minor compromises in one use case.
What Happens If I Leave the Dashboard at Full Brightness?
Image retention risk increases significantly on LCD panels during 24/7 operation. Manufacturers recommend 50–70% brightness for static content to extend panel life. While modern monitors are more resistant than older models, exceeding this range for weeks at a time can produce visible ghosting in fixed UI areas like sidebars or headers.


